

Bitcoin (BTC) has lost 6% of its value within eight days after reaching new all-time highs (ATH). While recent technical signals point to increased market uncertainty, a short-term drop followed by a recovery in whale activity has sparked expectations that some large investors might be returning to accumulation.
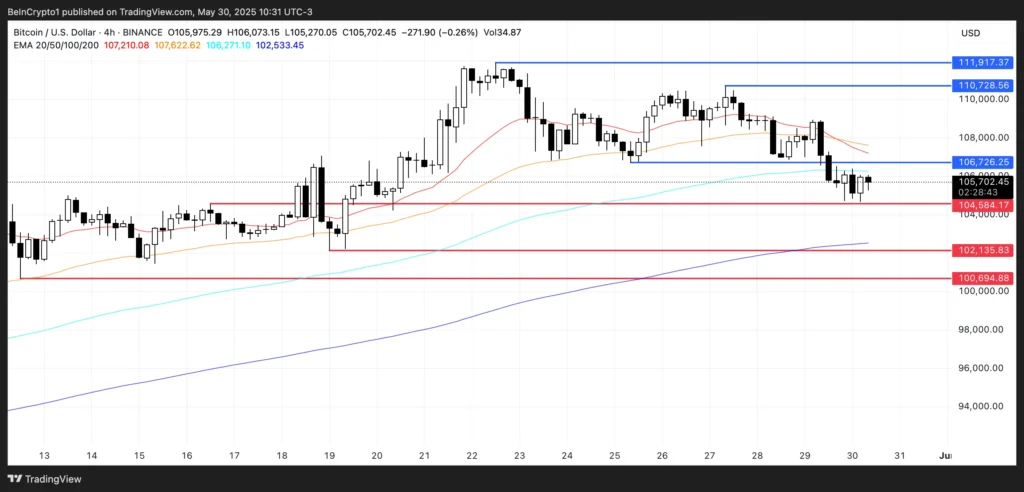
However, as the Ichimoku Cloud shows weakness and BTC continues to trade below critical support levels, bearish indicators are increasing. With the price hovering just above $104,584, the threat of another death cross and deeper downside potential remains unless bulls can gain momentum above resistance.
Whale Numbers on the Rise Again
The number of Bitcoin whales (wallets holding between 1,000 and 10,000 BTC) dropped to 2,002 earlier this week but has slightly rebounded to 2,006.
This short decline followed a sharper drop from 2,021 on May 25, marking a notable short-term reduction among large holders. However, the recovery may suggest that some whales are resuming accumulation.
Though the fluctuation is minor, such changes are closely monitored as they often signal shifts in market sentiment or price action. Tracking whale behavior is crucial due to its substantial impact on Bitcoin’s liquidity and volatility. A decrease in whale numbers typically reflects profit-taking or distribution, which can signal market cooling.
On the other hand, as observed now, stabilization or an increase can ease investor concerns and support the price at higher levels.


A rebound in large holder numbers after a sharp decline may indicate renewed confidence among key players, potentially reducing sell pressure and helping Bitcoin maintain its current range.
Technical Indicators Are Bearish, BTC Struggles Below Key Levels
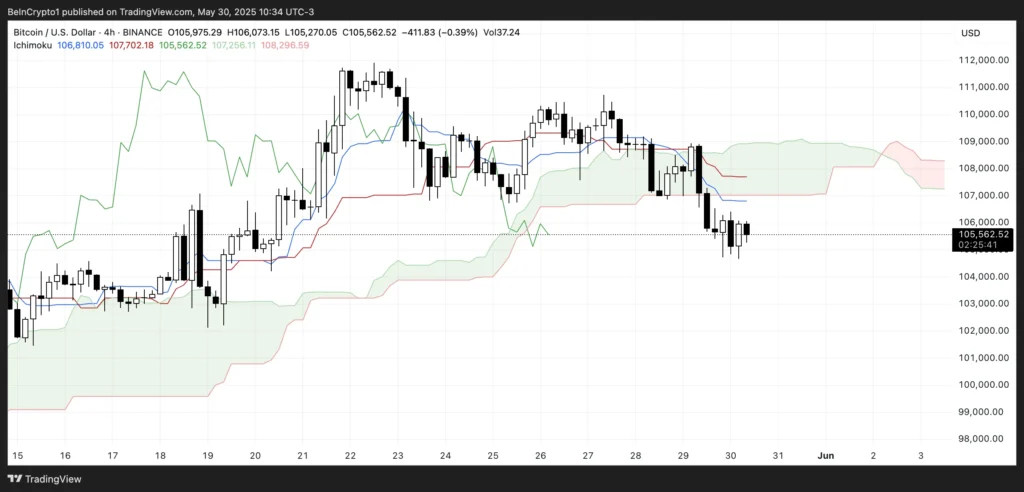
The Ichimoku Cloud chart for Bitcoin displays a short-term bearish structure.
The price is currently located below the Kumo (cloud), indicating that BTC is trading in a weak zone based on historical and projected momentum.
The future cloud is red, suggesting the near-term trend will remain bearish, unless a bullish reversal breaks above the upper limit. The Tenkan-sen (blue line) is below the Kijun-sen (red line), confirming short-term downward momentum. Both lines slope downward, adding further bearish signals.
The Chikou Span (green lagging line) sits below both the price and the cloud, reinforcing the lack of bullish confirmation.
The future cloud is narrowing, pointing to potential price stagnation or equilibrium. For a true bullish shift, the price needs to break above the cloud and flip the future Kumo from red to green.
Bitcoin Faces Potential Death Cross

Bitcoin recently experienced a death cross, and technical indicators suggest another may be approaching. The price is currently trading just above critical support at $104,584, which has acted as a short-term floor.
If this support fails, the next downside targets are $102,135 and potentially as low as $100,694 if selling pressure increases.
The presence of consecutive death crosses, combined with weakening price action near these levels, increases the likelihood of a deeper correction in the short term.
On the upside, if Bitcoin manages to build strong momentum and initiate a rebound, it could retest the $106,726 resistance.
A breakout above this level could trigger a sharper rally toward $110,728, with the possibility of reaching $112,000 if the upward trend accelerates.


Looking at past bull runs, it’s clear that Bitcoin’s price volatility is a constant. While the market is still volatile, I’m curious whether this current pullback is a healthy consolidation before another major jump, or if there’s something deeper at play here.