
In a world drowning in data, Power BI AI is the magician that takes raw numbers and weaves them into narratives you can act on. No more staring blankly at spreadsheets — this tool brings insight, context, and surprise, all with minimal effort.
💡 What is Power BI AI?

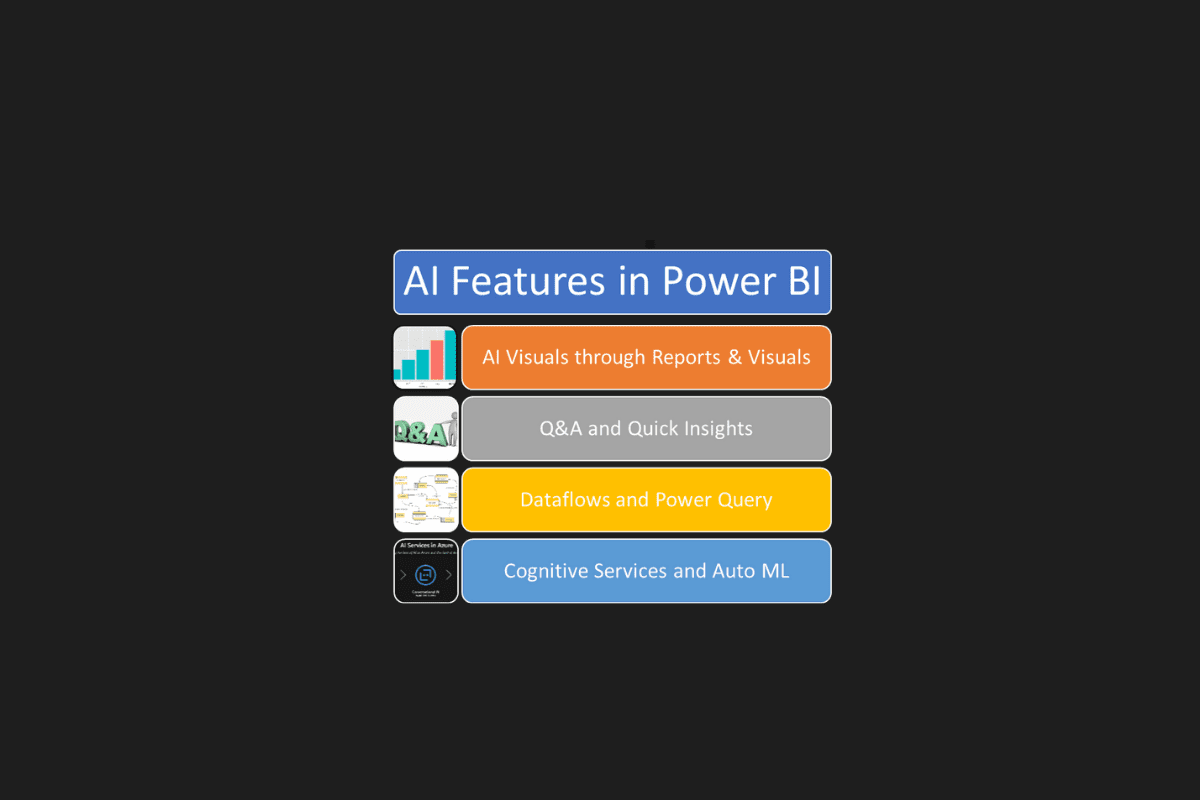
Power BI, Microsoft’s flagship business intelligence & analytics platform, has evolved beyond charts and dashboards. With AI features baked in, it now offers:
- Natural language queries (type your question, get visual answers)
- Pre-trained machine learning insights via “AI Insights” in Power Query / modeling layer
- Visual AI analytics like Key Influencers, Decomposition Tree, anomaly detection, and forecasting
- Azure / Cognitive Services integration (sentiment analysis, text analytics, vision, etc
- Copilot / AI-augmented modeling & “Prep for AI” tooling to guide AI interactions and context in your data models
In short: Power BI is no longer just a visual tool. It’s becoming your data storytelling assistant.
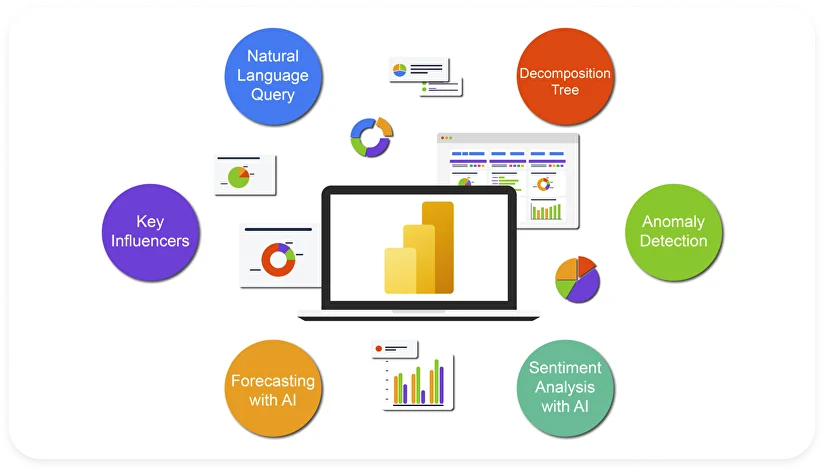
🔑 Key Features of Power BI AI
Here are the standout AI-powered features that make Power BI shine, in a “storytelling through data” kind of way:
| Feature | What It Does | Why It’s Powerful |
|---|---|---|
| Natural Language / Q&A | You can ask your data questions in plain English (e.g. “What were my top-selling products in June?”) and Power BI will generate tables or visuals automatically. | No knowledge of formulas or SQL required — data becomes conversational. |
| Key Influencers | Analyzes which factors most impact a target metric (e.g. what drives sales, churn, profit) | Helps you uncover “why” behind the numbers without manual regression. |
| Decomposition Tree | Lets you break down a metric across multiple dimensions interactively. It suggests which dimension to drill into next. | Great for root cause analysis and ad hoc exploration. |
| Anomaly Detection | Automatically spots outliers in time-series data (spikes, drops) and can explain them. | Reveals hidden surprises in your data you might otherwise miss. |
| Forecasting / Predictive Analytics | Uses past patterns to project future values — e.g. sales forecasts, trend lines. | Helps you move from reactive to proactive decision-making. |
| AI Insights in Power Query / Data Prep | In Power BI Desktop, the “AI Insights” pane gives you access to pre-trained models (text analysis, cognitive services) to augment your data during transformation. | Enrich your data before analysis—better inputs, better outputs. |
| Copilot & “Prep data for AI” tooling | You can add metadata, trigger phrases, “verified answers,” and context to your semantic model so that Copilot can respond more accurately. | Makes the AI more trustworthy, grounded, and relevant to your domain. |
🌟 What We Loved
- Instant insights, minimal effort — ask questions, get visuals & explanations in seconds.
- Democratizes analytics — whether you’re a business user or an analyst, Power BI AI bridges the gap.
- Smart visuals that think for you — AI suggests which graphs or breakdowns to explore.
- Uncover hidden stories — anomalies, influencers, root causes all surfaced automatically.
- Tight Azure & Cognitive integration — sentiment, language, image analytics, all in one workspace.
- Guided AI interaction — features like “Prep for AI” help you set the stage so AI delivers better results.
⚠️ Where It Still Needs Work
- Data quality matters more than ever — messy or ambiguous data leads to weak or misleading insights.
- Less control for power users — algorithmic “decisions” sometimes need manual override.
- Performance & scale — large datasets and complex models may slow things down.
- Transparency & trust — users want to understand why AI made a recommendation.
- Feature access / licensing — some AI features may require premium or special licensing.
🚀 How to Use Power BI AI (In Simple Steps)
- Load & prepare data — clean, structure, ensure it’s semantically meaningful.
- Enable AI features / Insights in Power Query or modeling layers.
- Ask your questions via Q&A / Natural language interface.
- Use AI visuals like Key Influencers, Decomposition Tree, anomaly detection.
- Add context via “Prep data for AI,” set verified answers, add metadata.
- Customize & validate outputs — sometimes tune what was auto-generated.
- Publish & share — let stakeholders explore with AI-powered insights.
🏁 Final Verdict
Power BI AI brings a new dimension to business intelligence — turning rote dashboards into interactive, narrative-driven data stories. Just like Magisto transforms raw footage into emotional cinematic stories, Power BI AI transforms raw data into insightful, strategic narratives.
If you’re a business leader, analyst, marketer, or creator: this is your gateway to making data accessible, intelligent, and conversational. The future of analytics is less about charts and more about stories — and Power BI AI is one of the strongest storytellers in the game.
✅ Top Feature Pick: Key Influencers + Natural Language Q&A — ask a question, get explanations, see what factors matter most — all without writing a line of code.
Would you like me to turn this into a video script (with voice flow, hooks, pacing) or a blog post version ready for SEO publishing?
You Might Also Like;
- The View That Changes Everything: Artemis 2’s Deep Space Eclipse
- YouTube’s Digital Clone Era: Create Your AI Avatar for Shorts
- Petcube GPS Tracker Review: Specs, Features & Price
-

-

-

-

-

-

-

-
-

-

-

-

